What Google Analytics Tracking Code Looks Like
Google Analytics Tracking Code Snippet
![Google Analytics Tracking Code. Google Analytics Tracking Code.]()
Google Analytics Tracking Code Snippet
As you can see, from the image above, the analytics tracking code is a pretty short and simple piece of Javascript code. Placing this code on the pages of your blog or website will allow you to see lots of information about the visitors to your website include, live, real time tracking of visitors on your website.
What Google Analytics Tracking Code Reveals About your Website Visitors
After the tracking code has been installed to your blog or website, when you log in to Google Analytics, click on the REPORTING tab and you will see the following on your screen:
Google Analytics Tracking Code Reporting Tab.
![Google Analytics Tracking Code Reporting Tab. Google Analytics Tracking Code Reporting Tab.]()
Google Analytics Tracking Code Reporting Tab.
The left hand column contains links, broken up into several different sections, to view various data about your blog or website visitors. Below is a list of each of these sections and the information links contained within them.
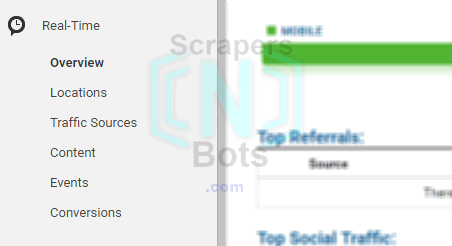
- Real Time: shows information about visitors, who are live, right now, on your website or blog. Reference.
- Overview - provides an information overview of all the live visitors on your website which include the pages visitors are on right now, and how long they have been on the webpage. There is also a locations map to show you where your visitors are coming from, geographically, as well as if they are visiting via a computer or smart device like cell phone or tablet.
- Locations - where your website visitors are coming from, geographically.
- Traffic Sources - how your live website visitors arrived to your website such as the referring website, meaning the website your visitor clicked a link on to arrive at your website.
- Content - more information about the pages your live website visitors are view right now such as the title of the web page they are on.
- Events - website visitors interactions with content on your web pages that can be tracked independently from a web page. This can be when the user clicks a download link, or plays a video on your web page. These are two simple examples of actions you might want to track as events. Reference.
- Conversions - in analytics you can set up goals. This is where you can measure and look for visitors on your site taking specific actions. For example lets say you want to see how many people fill out a form on one of your web pages. Set that up as a goal and conversions will reveal, live, when a visitor performs this goal or action.
Google Analytics Real Time Visitors Tab.
![Google Analytics Real Time Visitors Tab. Google Analytics Real Time Visitors Tab.]()
Google Analytics Real Time Visitors Tab.
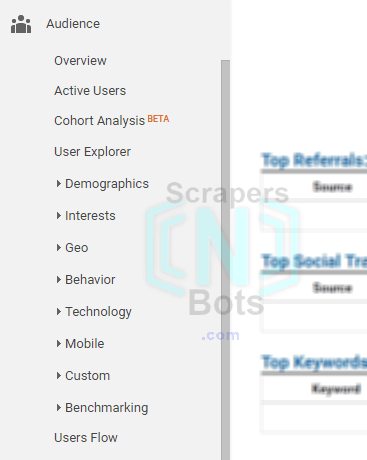
- Audience: provides great details about the charactertics of your websites visitors such as age, gender, what device/browser they are visiting your site from. Reference
- Overview - panel that presents a general overview of your website visitors such as the number of daily visitors, where they are from, etc.
- Active Users - presents a graph that provides a birdseye view of the number of daily visitors to your website over a 1 day, 7 day, 14 day or 30 day overview. Reference.
- Cohort Analysis - helps you understand the behavior of component groups of users apart from your user population as a whole. Reference.
- User Explorer - allows you to examine individual behavorior on your website as opposed to aggregate user behavior. Reference.
- Demographics - provides information about the age and gender of the visitors to your website or blog. Reference.
- Overview - shows two graphs that present an overview of the percentage of your sites visitors ages and gender.
- Age - presents the behavior/activity of your sites visitors based upon their age group which helps provide clearer information about which age groups like your websites pages the best. For example, you can compare the bounce rate of people in their twenties versus thirties.
- Gender - presents the behavior/activity of your sites visitors based upon their gender which helps provide clearer information about whether women or men like your websites pages the best. For example, you can see if your website is more popular with men or women.
- Interests - provides a grouping and breakdown of the general interests of your websites visitors. Groups that analytics break down visitors by include 'movie lovers', 'shutterbugs', 'tv lovers', etc. Google gets this information from things like third party cookies. Reference
- Overview - shows, in graph format, the percentage of your blog or site visitors who fall into certain interest groups. These graphs are broken down into three parts, Affinity Category, In-Market Segment and Other.
- Affinity Categories - provides much more detailed info about the general interests of you websites visitors. This allows you to determine which people of which interests engage with your site in the most as well as which interest categories contain people who tend to produce a high bounce rate and/or leave your site quickly. For example, at Scrapers〘N〙Bots, the highest percentage of visitors are 'Technophiles'(no surprise there)
- In-Market Segments - composed of people who are actively searching and comparing your website or blogs product/service. These people have shown, via websites and search they have conducted recently, they are in the market for a product or service similar to the subject matter of your website.
- Here is a more detailed explanation of the difference between Affinity Categories and In-Market Segments.
- Other Categories - categorizes visitors based on the specific content they actually consume/purchase, along with how recently and frequently they consume that content.
- Geo - provides information about the visitors of your website in terms of where they live and the languages they speak.
- Language - provides a breakdown of your websites visitors based upon their natural language.
- Location - provides a breakdown of the percentages of people who visitor your site and their locations/countries around the world they visit you from.
- Behavior - provides information regarding visitors to your website.
- New vs Returning - comparison and analysis of percentage of your sites visitors who have never been there before vs returning visitors. For example, at Scrapers〘N〙Bots, returning visitors interact with many more pages during their visit than new visitors.
- Frequency and Recency - can be used to see how many people only visit the site once, compared to more than once. Also reveals the time span between visits (for repeat visitors) This is useful to see what percentage of your sites visitors return again.
- Engagement - reveals the amount of time (number of seconds/minutes, etc.) visitors spend on your site. Whatever you can do to get your visitors to stay longer, the better.
- Technology - reveals information about the internet device, browser and network your sites visitors are using/coming from.
- Browser & OS - reveals what percentage of your visitors are using what web browser, computer operating system, screen resolution, etc. This data is useful, for example, if you see in Google Analytics that most of your visitors use the Internet Explorer web browser, you know to make it a priority to make sure you website behaves and looks the way you desire when viewed with Internet Explorer.
- Network - reveals what percentage of your visitors are coming from which internet service providers and which hostname. For example, at Scrapers〘N〙Bots, the majority of visitors have Time Warner Cable for an internet service provider.
- Mobile - provides information about what devices are used to visit your website, ie., computer, tablet, cell phone. It has become quite surpise just how much mobile device visitors are overtaking the internet.
- Overview - breaks down the traffic volume and specifics based upon the device they are using, desktop, tablet or mobile. Scrapers〘N〙Bots traffic from desktops still accounts for over 60% of the traffic and 40%, mobile devices, which is a lower than normal (relative to most other websites) amount of mobile device traffic.
- Devices - gets much more specific about the exact devices used when visiting your website such as Iphone, Ipad, Samsung SM-G900V Galaxy S5, etc.
- Custom - allows you to collect and analyze data that Google Analytics doesn't automatically track, like demographic data. Reference.
- Custom Variables
- User Defined
- Benchmarking - allows you to compare your analytics data with other websites/companies in industries similar to yours or select from a list of various industries (over 1,500 potential industries in the list to choose from.) such as Computers and Electronics or Arts and Entertainment.
- Channels - compare statistics of your website with others based upon channels, i.e., organic search, direct (the typed your url in their web browser or clicked a web browser bookmark), referral, social, other, display, email, other advertising, paid search. For example, Scrapers〘N〙Bots visitors have a much higher proportion of organic traffic (visitor performed a search and clicked a search result) the most other websites in a similar industry.
- Location - compares the physical location (country) of the visitors of your website to other websites similar to yours. For example, Scrapers〘N〙Bots has a higher proportion of United States, UK, and Canada traffic than other websites in a similar niche.
- Devices - compares proportion of your sites visitors based upon the device they use to visit (mobile, desktop, tablet).
- User Flow - allows you to see a birdseye view of the travel path visitors took visiting your website, meaning, the page they entered your site from, the pages they went to from there, right down to the page they left your site from.
Google Analytics Audience Tab.
![Google Analytics Audience Tab. Google Analytics Audience Tab.]()
Google Analytics Audience Tab.
- Acquisition: how your website 'aquired' its visitors, i.e., where they came from to get to your website.
- Overview - a general overview of how your website 'aquired' its visitors, i.e., where they came from to get to your website, i.e., organic search traffic, direct, referral, social, other.
- All Traffic
- Channels - channels is almost the same as the Acquisition Overview, except it gives you a graph to go along with the acquisition, behavior and conversions information.
- Treemaps - the Treemaps report (represent data as rectangles) lets you visually explore trends in your Acquisition channels so you can more easily visualize your website or blogs incoming traffic in a way where you can see the relative importance of, and the relationship between, different entities. Reference
- Source/Medium - this shows you exactly where your website traffic is coming from with the source producing the highest traffic at the top and the sources producing the least amount of traffic at the bottom.
- Referrals - this is very similar to Source/Medium except it narrows down information about traffic sources that only come from referrals, meaning, mostly, links clicked from other websites.
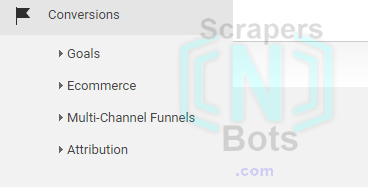
Google Analytics Conversions Tab.
![Google Analytics Conversions Tab. Google Analytics Conversions Tab.]()
Google Analytics Conversions Tab.
![Google Analytics Tracking Code. Google Analytics Tracking Code.]()


